
The Case Management Dashboard gives you an overview of cases:
- Tracking how many of the cases are in open, in progress, resolved, or canceled status
- Calculating the average time it takes to resolve a case after it is created
- Provides a graph showing case activity over time
- Sorts the cases by priority, location, program and question.
To navigate to Case Management Dashboard:
-
Click on Dashboards on the Intouch Intelligence menu.
- On the Dashboards menu, click on the Case Management Dashboard option
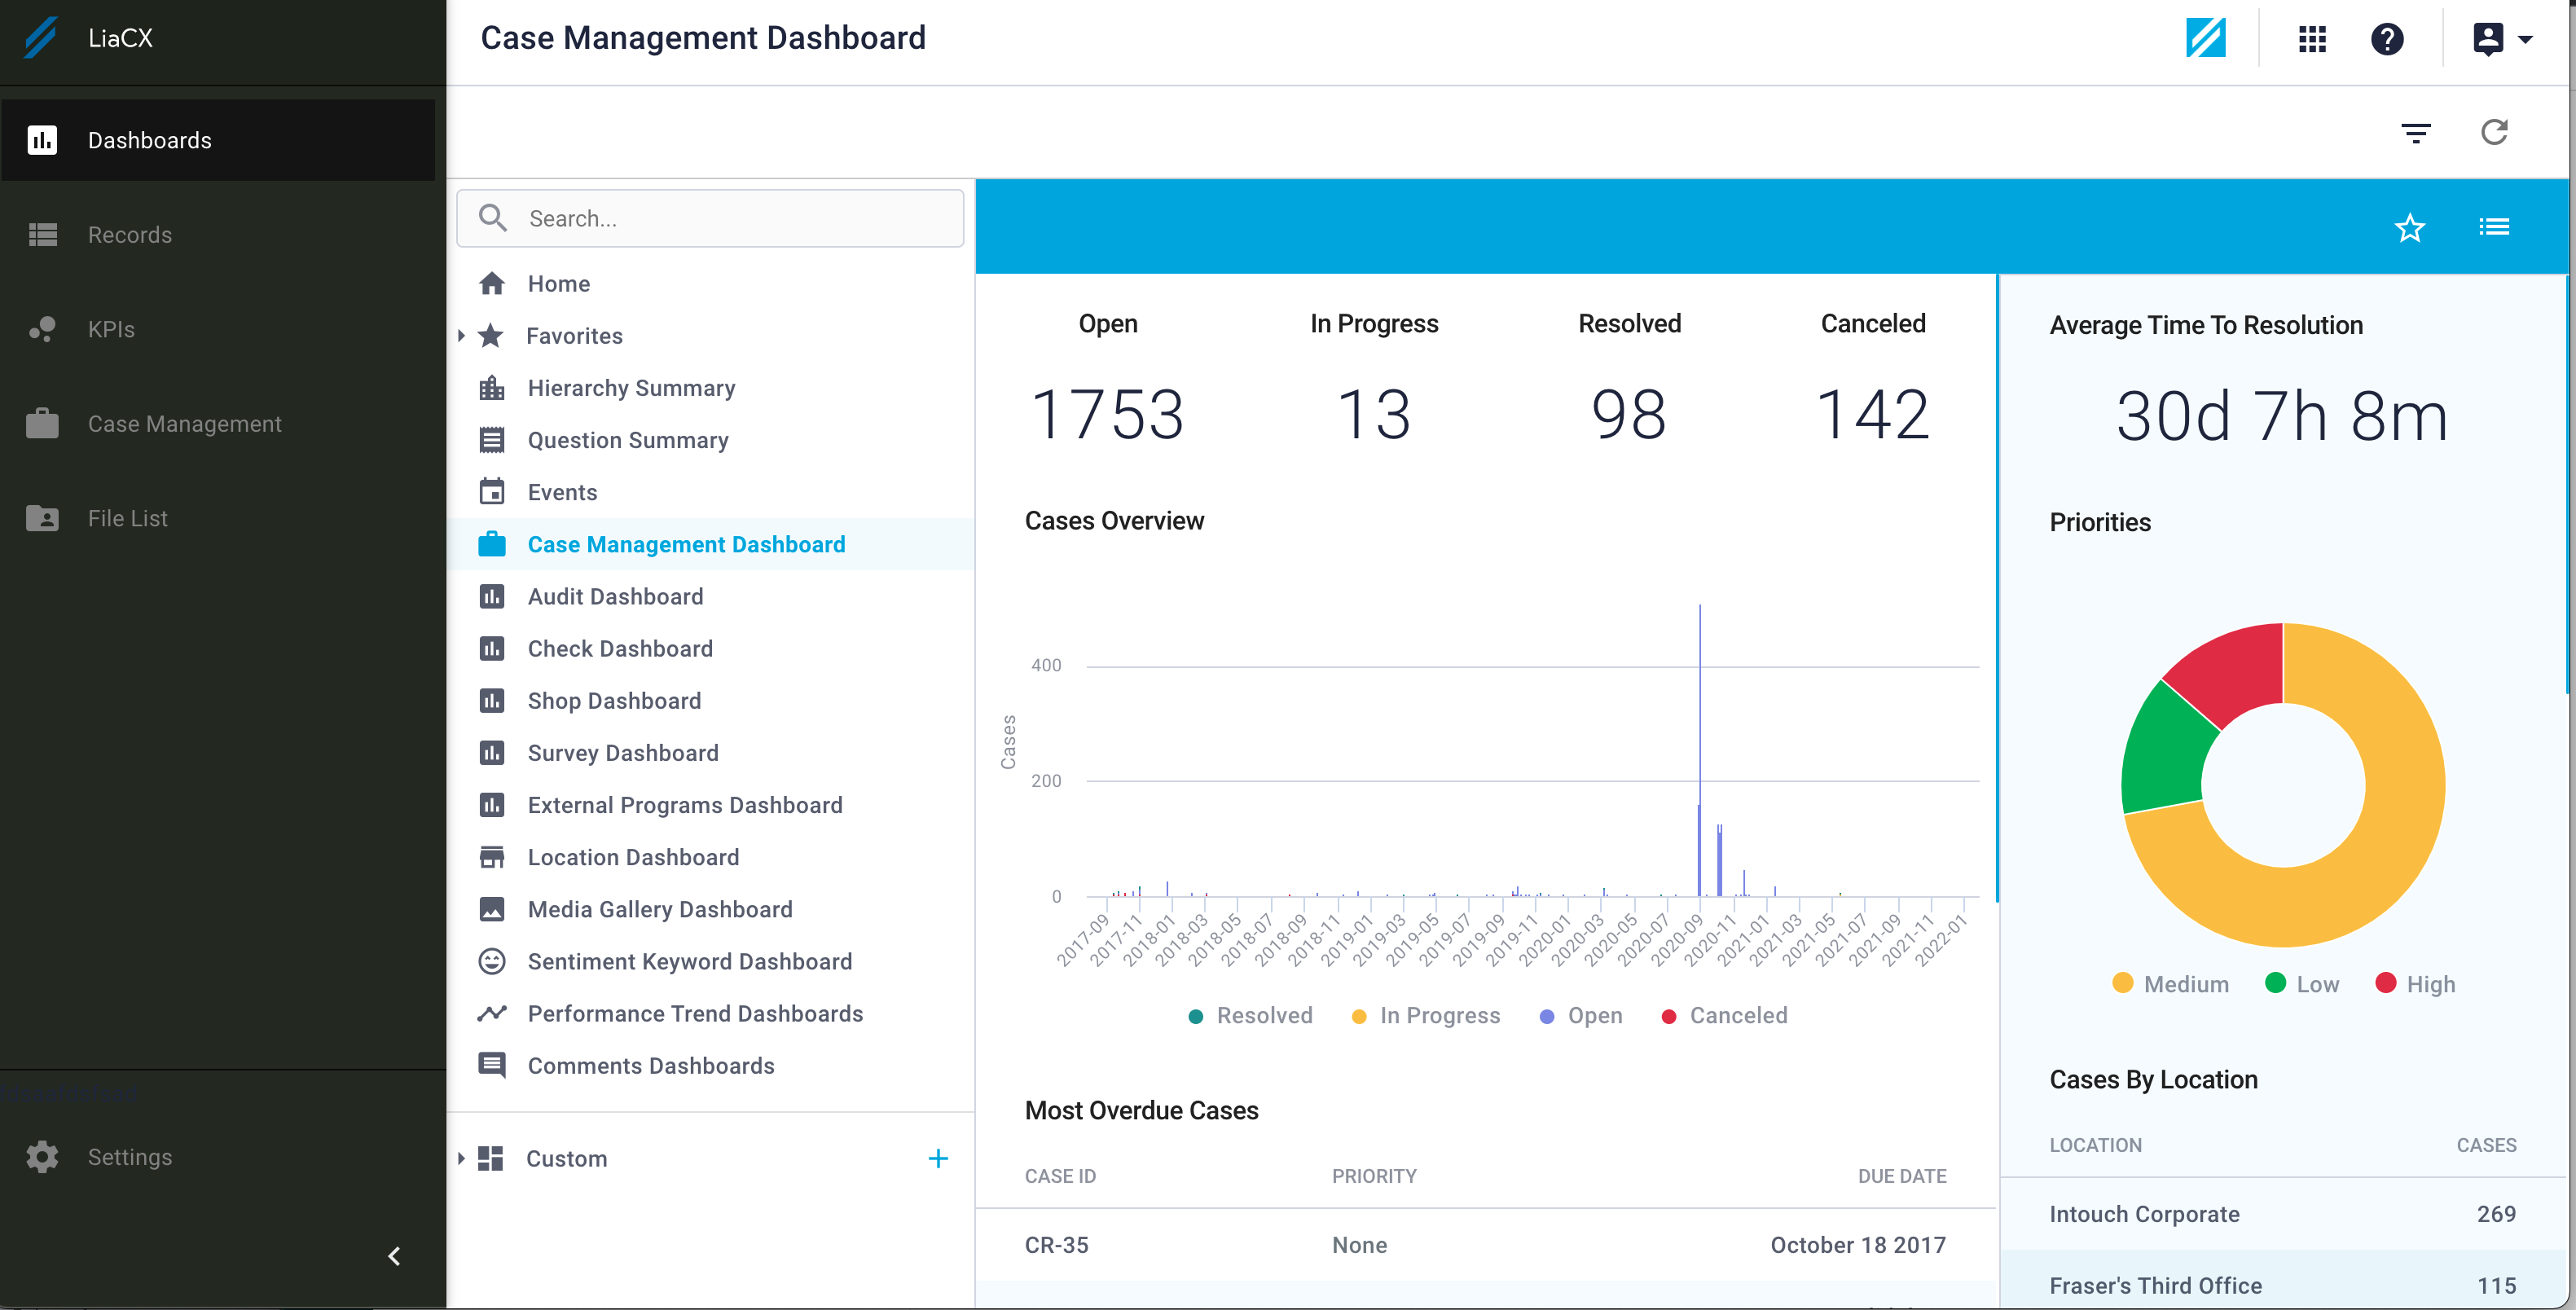
Case Management Dashboard Details
Right Panel:
Highlights:
This section displays the number of cases that are:
- Open
- In Progress
- Resolved
- Cancelled

Cases Overview:
This section displays a graph displaying case activity over time. Each case status is indicated with a different color. You can hover over each color coded status on the graph to find further information, which include:
- Date
- Number of Open, Resolved, Cancelled and In Progress cases.

Overdue Cases:
This section displays a list of the most overdue cases.

Left Panel:
The Average Time to Resolution: The average time taken for all cases to be resolved
Priorities - This highlights how the total number of cases are broken down in terms of priority level - Low, Medium, High.
Cases by Location/Program/Question - Sorts out the cases in terms of locations, programs and questions.

To learn more about Case Management, Click Here.
Comments
0 comments
Article is closed for comments.